In 2026, buyers research, compare and shortlist vendors before sales ever gets involved. AI tools have moved that evaluation off your site. Buying committees have grown. Targeting precision has dropped across every paid channel.
The result is a funnel that looks fine on paper but leaks revenue at every stage. MQL volume grows while deal quality falls. CAC payback stretches while pipeline dashboards stay green.
Activity metrics are telling SaaS teams what they want to hear. The SaaS marketing metrics that hold up in 2026 are tied to qualified pipeline, CAC payback and revenue retention.
This guide covers every B2B SaaS marketing KPI and SaaS marketing benchmark worth tracking, with formulas and benchmarks for every funnel stage.
Why Should SaaS Companies Track Marketing Metrics?
SaaS marketing metrics are quantitative indicators. They measure how efficiently marketing spend generates qualified pipeline, activates users, retains customers and contributes to recurring revenue growth.
A one-time sale ends at the transaction. SaaS revenue compounds or collapses depending on what happens after the sale:
- A customer who churns in month three costs you the CAC you spent acquiring them plus the revenue you expected over their lifetime
- A customer who expands in month six multiplies the return on that same acquisition spend
HubSpot reports that nearly 30% of marketers saw decreased search traffic as consumers turn to AI tools. That means metrics that capture only on-site behaviour can miss a growing part of the discovery journey.
That dynamic makes marketing metrics in SaaS fundamentally different from those in transactional businesses. Traffic and lead volume tell you very little on their own. What matters is whether the leads you generate:
- Convert from MQL to SQL at a predictable rate
- Activate and reach first meaningful action fast enough to retain
- Stay long enough to recover CAC
- Expand through upsell and cross-sell to drive NRR above 100 percent
The teams that struggle are almost always optimising for MQL volume while ignoring what happens downstream.
SaaS Marketing Metrics Framework: Acquisition, Activation, Retention, Revenue
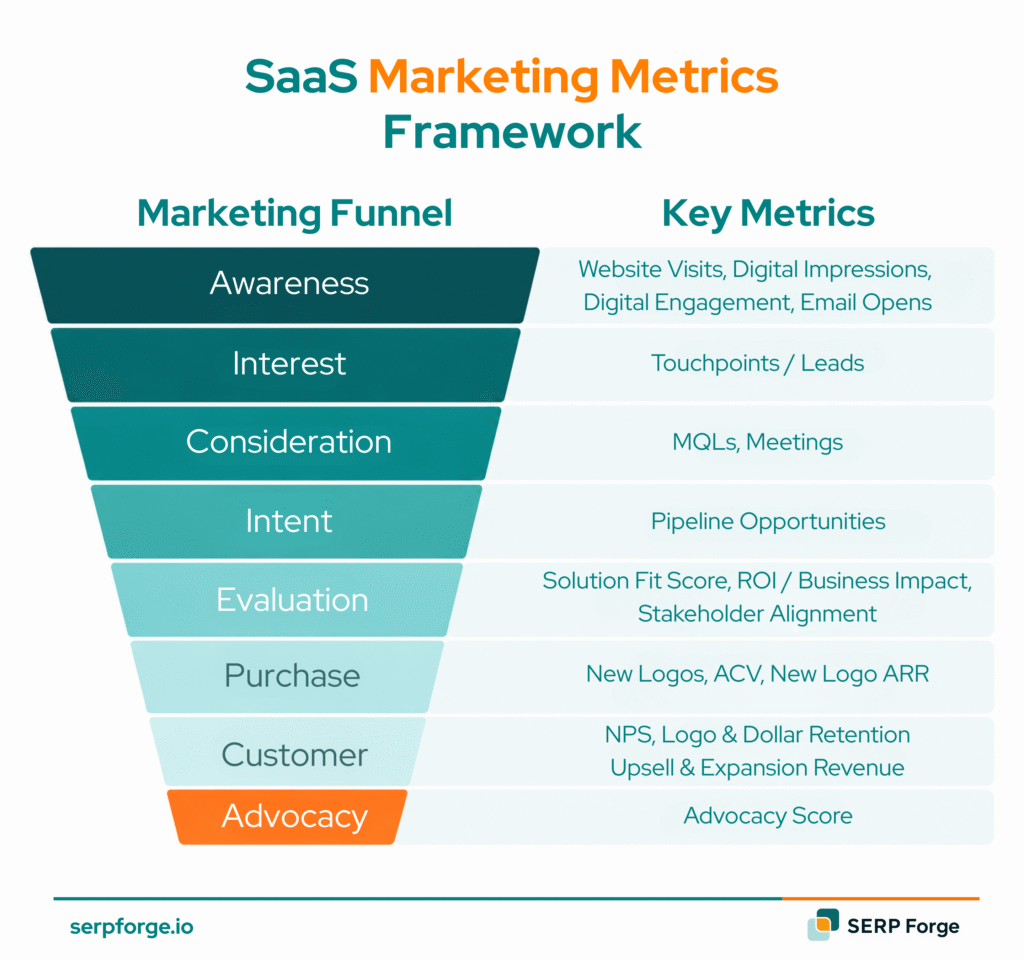
Before tracking individual SaaS marketing KPIs, you need a framework that maps them to the customer lifecycle. The four stages are:
- Acquisition: How efficiently are you generating qualified pipeline?
- Activation: Are new users reaching first value fast enough to convert?
- Retention: Are customers staying, expanding and recommending?
- Revenue: Is marketing spend translating to sustainable ARR growth?
Every metric in this guide sits within one of these four stages. Track at least two metrics per stage. Teams that only track acquisition metrics miss the signals that predict churn and expansion six months before they show up in the revenue numbers.
SaaS Acquisition Metrics to Track
The SaaS marketing metrics that govern acquisition tell you how efficiently spend is turning into qualified pipeline.
1. Website Traffic and Traffic Quality
Traffic volume tells you very little on its own. What matters is where visitors came from and whether they match your ICP.
In 2026, track three streams separately: branded organic, non-branded organic and AI-referred. Visits from ChatGPT, Perplexity, Gemini and Claude are trackable in GA4 as referral sessions. As buyers shift discovery to AI before opening a search engine, bundling this into general referral means your traffic reporting is already incomplete.
Beyond session data, track how often your brand appears in AI-generated answers for your top queries. A brand ranking on page one organically but absent from AI answers is losing early-stage discovery.
To measure, track two ratios:
- Non-branded traffic % = (non-branded organic sessions/total organic sessions) x 100
- AI referral traffic % = (sessions from AI referrers/total sessions) x 100. Tag ChatGPT.com, Perplexity.ai, Claude.ai and Gemini.google.com in GA4
A healthy B2B SaaS site runs 60 to 70% non-branded organic traffic. Below 50% signals over-reliance on brand and direct. AI referral traffic sits under 5% for most sites today but is the fastest growing stream. If yours reads zero, your GA4 tagging is broken.
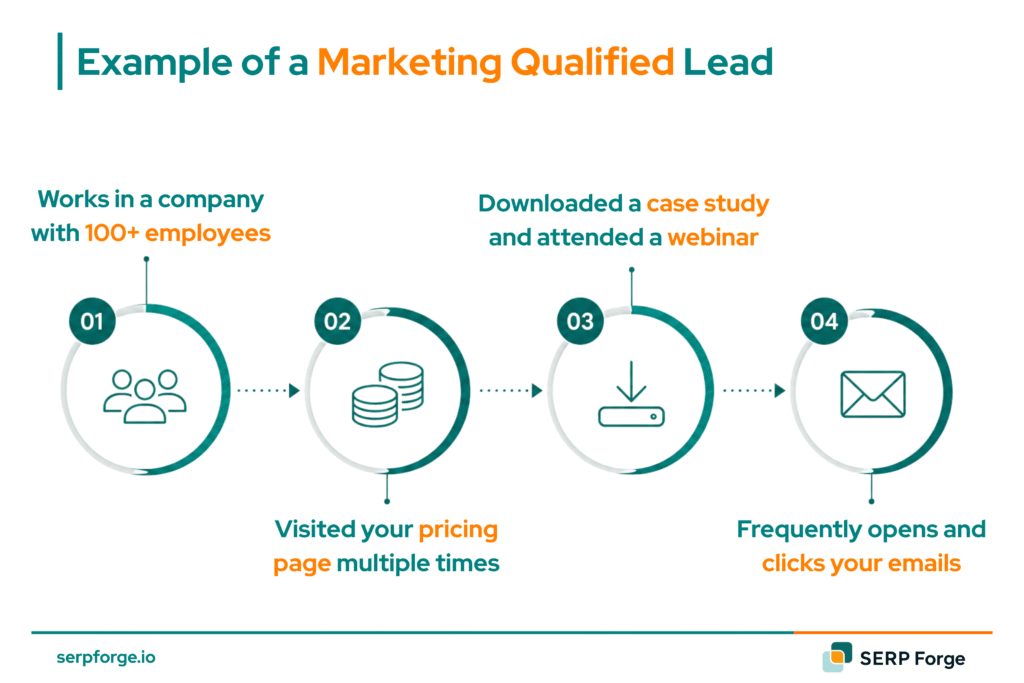
2. Marketing Qualified Leads (MQLs)
An MQL is a lead that meets your predefined engagement or firmographic criteria. The number alone means nothing. The MQL to SQL conversion rate is what tells you whether your qualification criteria are calibrated correctly.
To calculate, use:
- MQL to SQL conversion rate = (SQLs generated/MQLs generated) x 100
A healthy MQL to SQL conversion rate for B2B SaaS sits between 10 and 15%. Below 10% signals either poor lead quality or misaligned qualification criteria between marketing and sales.
3. Sales Qualified Leads (SQLs)
An SQL is a lead that sales has accepted as ready for active pursuit. The SQL acceptance rate, the percentage of MQLs that sales accepts without rejection, is the most honest indicator of marketing and sales alignment.
The formula to track:
- SQL acceptance rate = (SQLs accepted/MQLs passed to sales) x 100
SQL acceptance rate above 75% signals strong ICP targeting and aligned qualification criteria. Below 60% means marketing and sales are working from different definitions of a ready lead.
4. Lead Velocity Rate
Lead velocity rate (LVR) measures month-over-month growth in qualified leads. It is a leading indicator of future revenue. If LVR is positive and consistent, pipeline three to six months from now is predictable. If LVR is flat or declining, pipeline problems are already locked in.
Run this calculation:
- LVR = ((qualified leads this month – qualified leads last month)/qualified leads last month) x 100
LVR above 10% month-over-month is strong for a growth-stage SaaS company. Seed-stage companies should target higher. Scale-stage companies will naturally see LVR compress as the base grows.
5. Customer Acquisition Cost (CAC)
CAC is the total marketing and sales spend required to acquire one new customer. CAC is one of the most misunderstood B2B SaaS marketing metrics because most teams calculate it without including sales headcount and tooling. Blended CAC includes everything.
Measure it with:
- CAC = total sales and marketing spend/number of new customers acquired in the same period
CAC varies significantly by sales motion and ACV. Enterprise-focused SaaS with long sales cycles runs significantly higher than PLG-led products where self-serve acquisition keeps acquisition costs low.
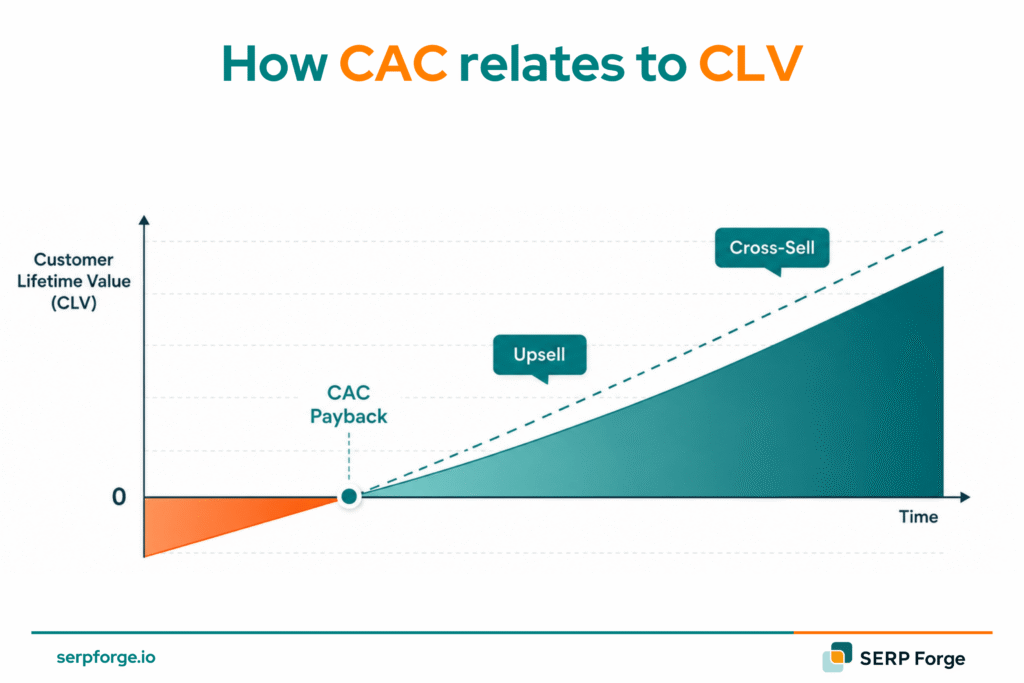
6. CAC Payback Period
CAC payback period tells you how many months it takes to recover the cost of acquiring a customer from their gross margin contribution. It is the metric that determines whether your growth is sustainable or cash-destructive. The generic median CAC payback is 9 months for companies with ACV below $5,000 and 24 months for those above $100,000 ACV.
The number to track:
- CAC payback period = CAC/(ARPA x gross margin percentage)
Under 12 months is strong for SMB SaaS. Under 18 months is acceptable for mid-market. Enterprise SaaS with high ACVs can sustain payback periods of 24 months or longer when NRR is above 120%.
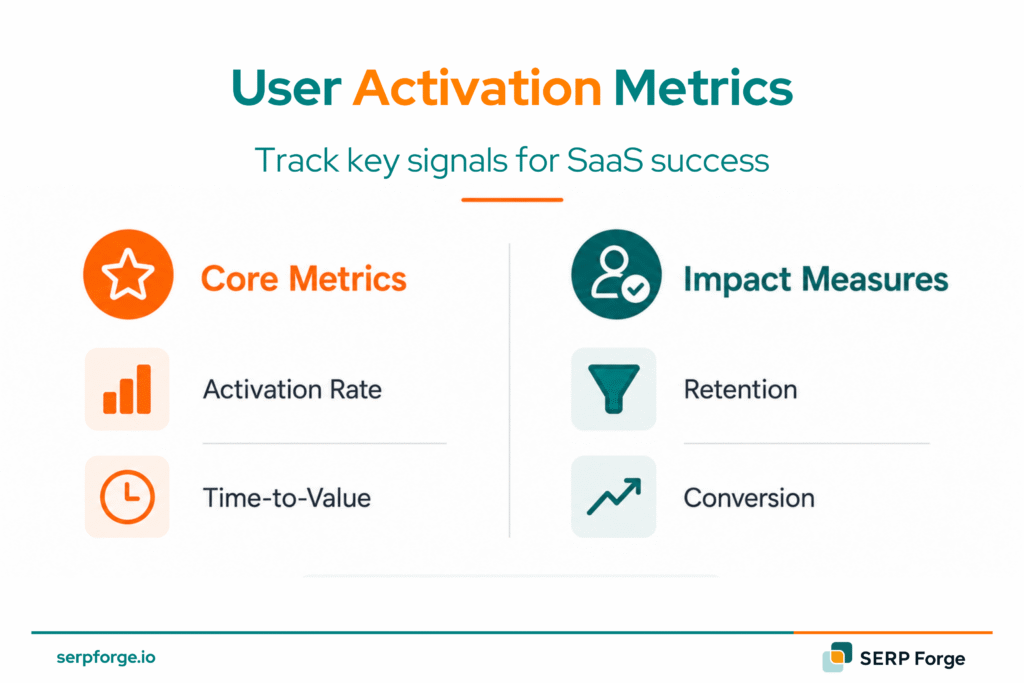
SaaS Activation Metrics to Track
Activation metrics tell you whether new users are reaching product value fast enough to convert and stay. These are the four to track:
7. Free Trial Signups
Free trial signup volume is only meaningful when segmented by source and ICP fit. A spike in trial signups from a paid campaign that brings in non-ICP users inflates the number while degrading downstream activation and conversion rates.
Track these numbers:
- Signup volume by source week-over-week per segment
- ICP match rate per segment: industry, company size, role
ICP-matched trial signups should account for at least 60% of total trial volume. Below that, your acquisition channels are pulling in audiences that will not activate or convert.
8. Activation Rate and First Meaningful Action
Activation rate measures the percentage of new users who complete their first meaningful action (FMA) within a defined time window. FMA varies by product but always maps to the moment a user experiences core product value for the first time.
Calculate using:
- Activation rate = (users who completed FMA/total new users) x 100
B2B SaaS activation rates average 25 to 40% within the first seven days, per Intercom benchmark data. Users who activate faster consistently convert to paid at higher rates. The longer the gap between signup and first meaningful action, the lower the free-to-paid conversion rate.
9. Free to Paid Conversion Rate
Free to paid conversion rate measures what percentage of free trial or freemium users convert to a paying plan. It is the metric that determines whether your PLG motion is working.
The ratio to monitor:
- Free to paid conversion rate = (users who converted to paid/total free users) x 100
B2B SaaS free to paid conversion averages 2 to 5% for freemium models and 15 to 25% for time-limited free trials. Reverse trial motions, where users start on a full-featured paid tier before dropping to free, consistently produce the highest conversion rates.
10. Demo to Customer Rate
Demo to customer rate measures the percentage of product demos that result in a closed deal. It is the clearest signal of sales and marketing alignment at the bottom of the funnel.
Track this number:
- Demo to customer rate = (customers won/demos completed) x 100
A healthy demo to customer rate for B2B SaaS sits at 20 to 30%. Below 15% signals either poor demo quality, wrong audience attending demos, or a pricing and packaging mismatch.
SaaS Retention Metrics and Churn KPIs
Retention metrics reveal whether your customer base is healthy before churn shows up in the revenue numbers. Here is what to measure:
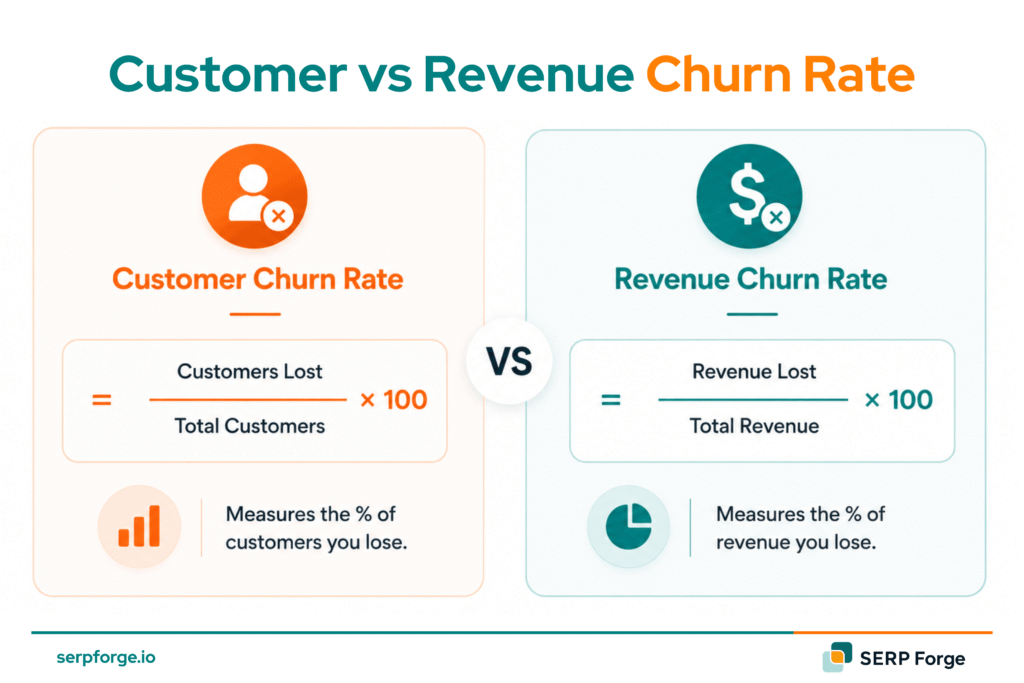
11. Customer Churn Rate
Customer churn rate measures the percentage of customers who cancel within a given period. It is the metric that determines whether your business grows or shrinks regardless of how much you spend on acquisition.
Use this formula:
- Customer churn rate = (customers lost in period/customers at start of period) x 100
Annual customer churn below 5% is strong for B2B SaaS. Monthly churn above 2% compounds into annual churn above 22%, which most acquisition engines cannot outpace.
12. Revenue Churn Rate
Revenue churn measures the percentage of MRR lost to cancellations and downgrades. It is more important than customer churn because a small number of high-value cancellations can collapse revenue while customer count stays flat.
To measure, track one ratio:
- Revenue churn rate = (MRR lost to churn and downgrades in period/MRR at start of period) x 100
Gross revenue churn below 8% annually is the benchmark for B2B SaaS. Above 10% means expansion revenue is fighting a losing battle against losses.
13. Net Revenue Retention (NRR)
NRR measures the revenue retained from your existing customer base after accounting for churn, downgrades and expansion. It is the single most important metric for SaaS business health because NRR above 100% means your existing customers grow your revenue without any new acquisition.
Calculate it using:
- NRR = ((MRR at start of period + expansion MRR – churned MRR – contraction MRR)/MRR at start of period) x 100
NRR above 110% is strong. Above 120% is exceptional and typical of best-in-class enterprise SaaS. Below 100% means you are shrinking without new acquisition to compensate. HubSpot says investors expect at least 90% GRR and 100% or higher NRR, making above-100% net revenue retention the baseline for proving retention-led SaaS growth.
14. Gross Revenue Retention (GRR)
GRR measures revenue retained from existing customers excluding expansion. Where NRR tells you about growth from the base, GRR tells you about the quality of your retention before upsell and cross-sell mask underlying churn problems.
The formula to run:
- GRR = ((MRR at start of period – churned MRR – contraction MRR)/MRR at start of period) x 100
GRR above 85% is the floor for healthy B2B SaaS. Below 80% means product-market fit or customer success execution needs urgent attention.
15. Customer Retention Rate
Customer retention rate is the inverse of churn. It measures the percentage of customers who remain active over a given period.
Track this ratio:
- Customer retention rate = ((customers at end of period – new customers acquired)/customers at start of period) x 100
Annual customer retention above 90% is the benchmark for B2B SaaS. Below 85% signals systematic issues in onboarding, product value, or customer success coverage.
16. Net Promoter Score (NPS)
NPS measures customer satisfaction and likelihood to recommend. In SaaS, NPS is a leading indicator of referral programme performance and organic word-of-mouth pipeline. A high NPS without a structured referral programme is a missed acquisition opportunity.
The calculation to run:
- NPS = percentage of promoters (score 9 to 10) minus percentage of detractors (score 0 to 6)
NPS above 40 is strong for B2B SaaS. Above 50 supports a customer referral programme. Below 30 means the product or customer experience needs attention before you invest in referral or advocacy channels.
SaaS Revenue Metrics
B2B SaaS marketing metrics at the revenue stage connect marketing performance directly to ARR growth, LTV and unit economics. These are the seven that matter most:
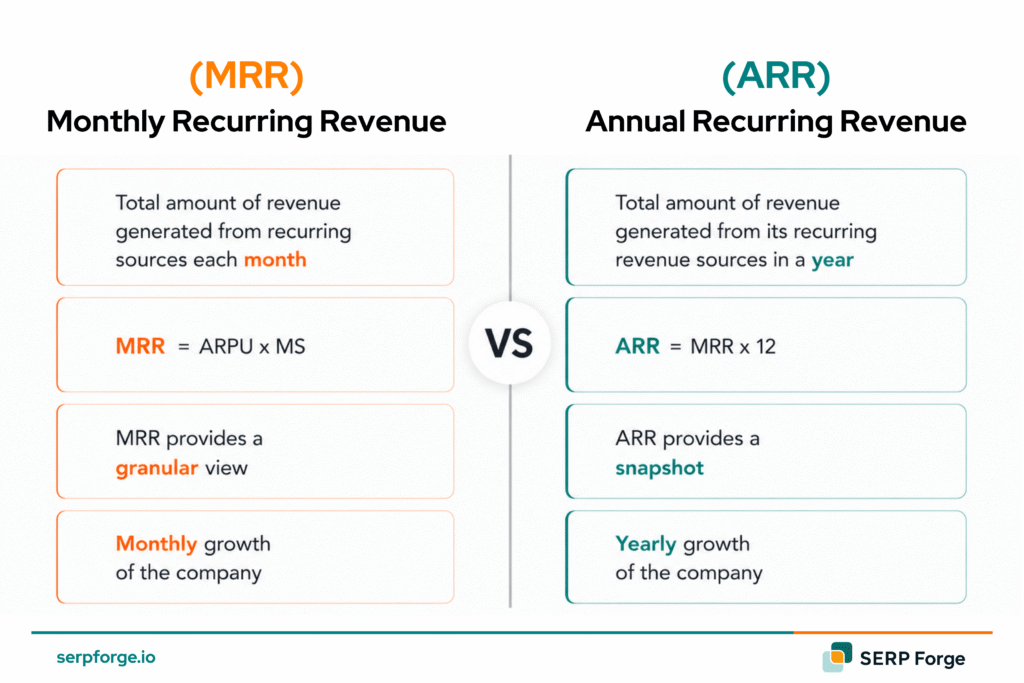
17. Monthly Recurring Revenue (MRR)
MRR is the normalised monthly revenue from all active subscriptions. It is the heartbeat metric of a SaaS business. New MRR, expansion MRR, contraction MRR and churned MRR each tell a different story about business health.
Measure it with:
- MRR = total number of active paying customers x average revenue per user per month
Track MRR growth rate month-over-month. A growth-stage B2B SaaS company should target 10 to 15% monthly MRR growth. At scale, 5 to 8% is strong.
18. Annual Recurring Revenue (ARR)
ARR is MRR multiplied by 12. It is the metric investors, boards and acquirers use to value SaaS businesses. ARR growth rate is the headline performance indicator for any growth-stage or scale-stage SaaS company.
Run this calculation:
- ARR = MRR x 12
Year-over-year ARR growth above 100% is exceptional at seed stage. Above 50% is strong at Series A. Above 30% is healthy at Series B and beyond.
19. Average Revenue Per Account (ARPA)
ARPA measures the average monthly revenue per active customer account. Tracking ARPA trends over time tells you whether your pricing and packaging is working and whether expansion motions are contributing meaningfully to revenue.
The number to track:
- ARPA = total MRR/total number of active accounts
ARPA should trend upward over time as expansion MRR compounds. A flat or declining ARPA signals that upsell and cross-sell motions are not working or that new customer acquisition is pulling in lower-value accounts.
20. Customer Lifetime Value (LTV)
LTV is the total revenue a customer is expected to generate over their relationship with your business. It is the denominator against which CAC makes sense. Without LTV, CAC is just a cost number with no context.
To calculate, use:
- LTV = ARPA/customer churn rate
LTV should be at least 3x CAC. Below that, customer acquisition is not economically sustainable at scale.
21. LTV to CAC Ratio
LTV to CAC ratio is the most fundamental unit economics metric in SaaS. It tells you whether the revenue a customer generates justifies the cost of acquiring them.
The ratio to monitor:
- LTV to CAC ratio = LTV/CAC
A ratio of 3:1 is the minimum for sustainable growth. 4:1 to 5:1 is strong. Above 5:1 often signals under-investment in growth. Below 3:1 means the business model needs repricing, better retention, or lower acquisition costs before scaling.
22. Marketing Efficiency Ratio (MER)
MER measures total revenue generated per dollar of total marketing spend. It is the blended efficiency metric that replaces fragmented channel ROAS when you want a single number to represent marketing’s contribution to revenue.
Calculate using:
- MER = total revenue/total marketing spend
A MER of 3:1 or above is healthy for most B2B SaaS companies. Below 2:1 means marketing spend is not generating enough revenue to justify the investment at current volume.
23. Pipeline ROAS
Pipeline ROAS measures the value of pipeline generated per dollar spent on a marketing channel. It is more forward-looking than revenue ROAS because it captures deals in motion before they close, giving you a faster feedback loop on channel performance.
The formula to track:
- Pipeline ROAS = pipeline value generated/channel spend in the same period
Target a pipeline ROAS of at least 4:1 for paid channels. SEO and referral programmes should produce pipeline ROAS well above that because the cost base is lower and the leads close faster.
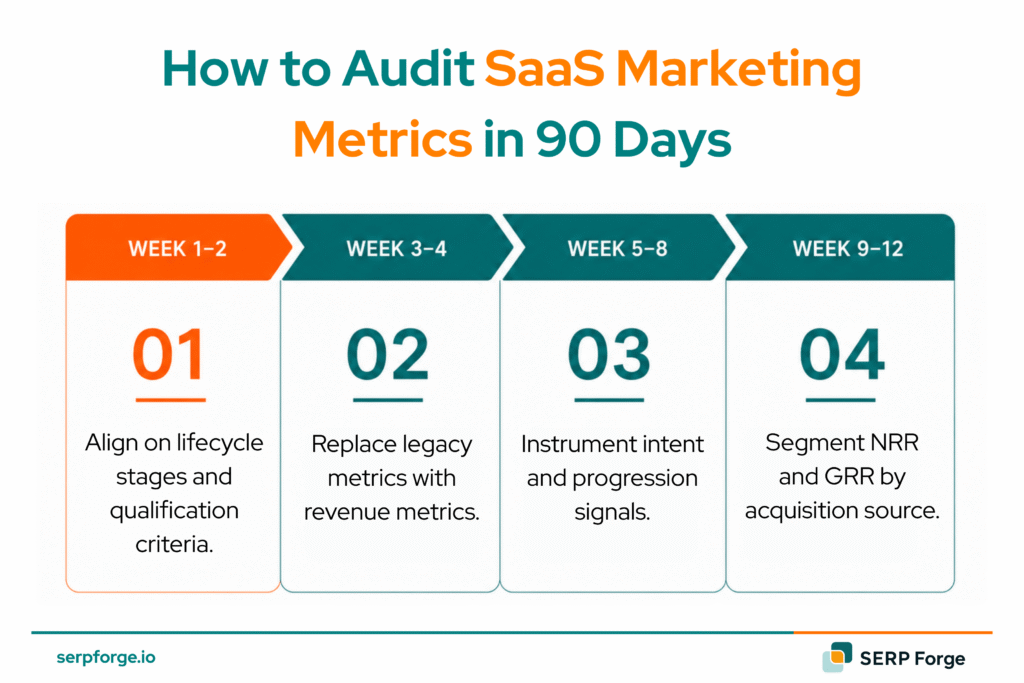
How to Audit SaaS Marketing Metrics in 90 Days
Teams need to stop tracking the wrong SaaS marketing metrics. and start connecting the right ones to revenue outcomes. Here is a 90-day reset:
Week 1 to 2: Align on Lifecycle Stages and Qualification Criteria
Sit down with sales and RevOps. Agree on what qualifies a lead as an MQL, what moves it to SQL and what disqualifies it at each stage. If marketing and sales use different definitions, every metric downstream is unreliable.
Week 3 to 4: Replace Legacy Metrics With Revenue Metrics
Pull your current marketing scorecard and identify every metric that measures activity rather than outcome. Replace cost per lead with CAC payback period. Replace channel ROAS with pipeline ROAS. Replace traffic with non-branded traffic share and MQL to SQL conversion rate.
Week 5 to 8: Instrument Intent and Progression Signals
Make sure tracking is in place for pipeline velocity, product activation rate and role-based ICP engagement. Add predictive lead scoring based on behavioural signals, firmographic fit and intent data to prioritise the leads most likely to convert.
Week 9 to 12: Segment NRR and GRR by Acquisition Source
Segment NRR and GRR by acquisition source; paid search, SEO, cold email, referral and events. Customers from certain channels retain and expand at significantly higher rates than others. That analysis should directly inform your budget allocation next quarter.
SaaS Marketing Benchmarks for 2026
The SaaS marketing benchmarks below give you a reference point for every metric covered in this guide:
| Metric | Strong | Acceptable | Warning Signal |
|---|---|---|---|
| CAC Payback Period (SMB) | Under 12 months | 12–18 months | Above 24 months |
| CAC Payback Period (Enterprise) | Under 18 months | 18–24 months | Above 36 months |
| LTV:CAC Ratio | Above 4:1 | 3:1–4:1 | Below 3:1 |
| Annual Customer Churn | Below 5% | 5%–8% | Above 10% |
| NRR (B2B SaaS) | Above 115% | 100%–115% | Below 100% |
| GRR (B2B SaaS) | Above 88% | 80%–88% | Below 80% |
| Free-to-Paid Conversion (Freemium) | Above 5% | 2%–5% | Below 2% |
| Free-to-Paid Conversion (Free Trial) | Above 20% | 15%–20% | Below 10% |
| MQL-to-SQL Conversion Rate | Above 15% | 10%–15% | Below 10% |
| MER (Marketing Efficiency Ratio) | Above 4:1 | 3:1–4:1 | Below 2:1 |
Ready to Turn Your Metrics Into a Revenue System?
Tracking metrics is only half the job. The other half is building the marketing system that moves them in the right direction.
SERP Forge builds full-stack B2B SaaS marketing systems that connect channel performance to pipeline outcomes. From bottom-funnel SEO to demand generation and GTM strategy, every channel we run reports to one number: your ARR.
Book a free growth audit with the SERP Forge team. 30 minutes, no prep needed. You will leave with a clear view of which metrics matter for your stage and which channels are moving them.
Conclusion
SaaS marketing metrics are only useful when they connect to revenue outcomes. Traffic, MQL volume and cost per lead tell you very little about whether your marketing is working. CAC payback, NRR, LTV to CAC ratio, pipeline ROAS and MER tell you everything.
Track two metrics per funnel stage. Build a scorecard that makes sense in a board meeting. Segment NRR and GRR by acquisition source and let that analysis drive your budget decisions next quarter.
FAQs
What are the most important SaaS marketing metrics?
CAC payback period, NRR, LTV to CAC ratio and pipeline ROAS are the four metrics that matter most. They connect marketing spend directly to revenue quality and sustainability.
What is a healthy LTV to CAC ratio for B2B SaaS?
A ratio of 3:1 is the minimum for sustainable growth. Most well-run B2B SaaS companies operate between 4:1 and 5:1. Above 5:1 often signals under-investment in growth channels.
How is NRR different from GRR?
NRR includes expansion revenue so it can exceed 100%. GRR only measures retained revenue before expansion, so it stays at 100% or below. You need both to see whether churn is being masked by upsell growth.
When should a SaaS company stop tracking MQLs?
When MQL volume stops predicting SQL conversion rate. Replace it with qualified pipeline created, which ties marketing output directly to revenue potential.
How do you measure SaaS marketing ROI?
Use MER for blended ROI, total revenue divided by total marketing spend. Use pipeline ROAS for channel-level ROI. Last-touch attribution understates impact in long B2B sales cycles, so multi-touch models give a more accurate picture.